We begin our M&A model by plugging into the spreadsheet some basic market data and corporate information about the target (“TargetCo”) and acquirer (“BuyerCo”). Market data can be obtained from a number of sources, including FactSet, CapitalIQ, Google Finance, Reuters, and Bloomberg. Most corporate information can be found in SEC filings available online at the EDGAR database. Some things to keep in mind:
- Make sure that the 52-week highs/lows are closing prices, not intraday trading prices.
- Basic shares outstanding should be the most recent figure available, from the latest 10-Q, 8-K, or other source, and should be adjusted for any transactions that would affect these figures (e.g. stock acquisitions) since they were last reported.
- Stock options and convertible securities details are usually found in the most recent 10-K, but can sometimes be found in the latest 10-Q.
- The LTM date is the ending date of the last fiscal quarter for which an 8-K earnings release or 10-Q/K is available. For example, if the last fiscal quarter ended June 30, but earnings have not been reported for that quarter, the LTM date is March 31.
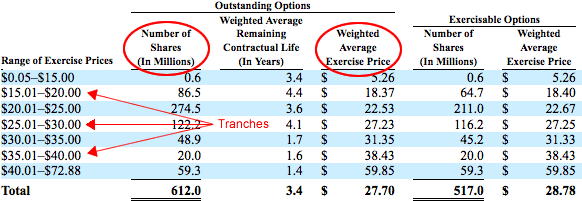
- When inputting options data, be sure to use options outstanding rather than options exercisable. Options usually vest automatically upon a change in control.